Dagster
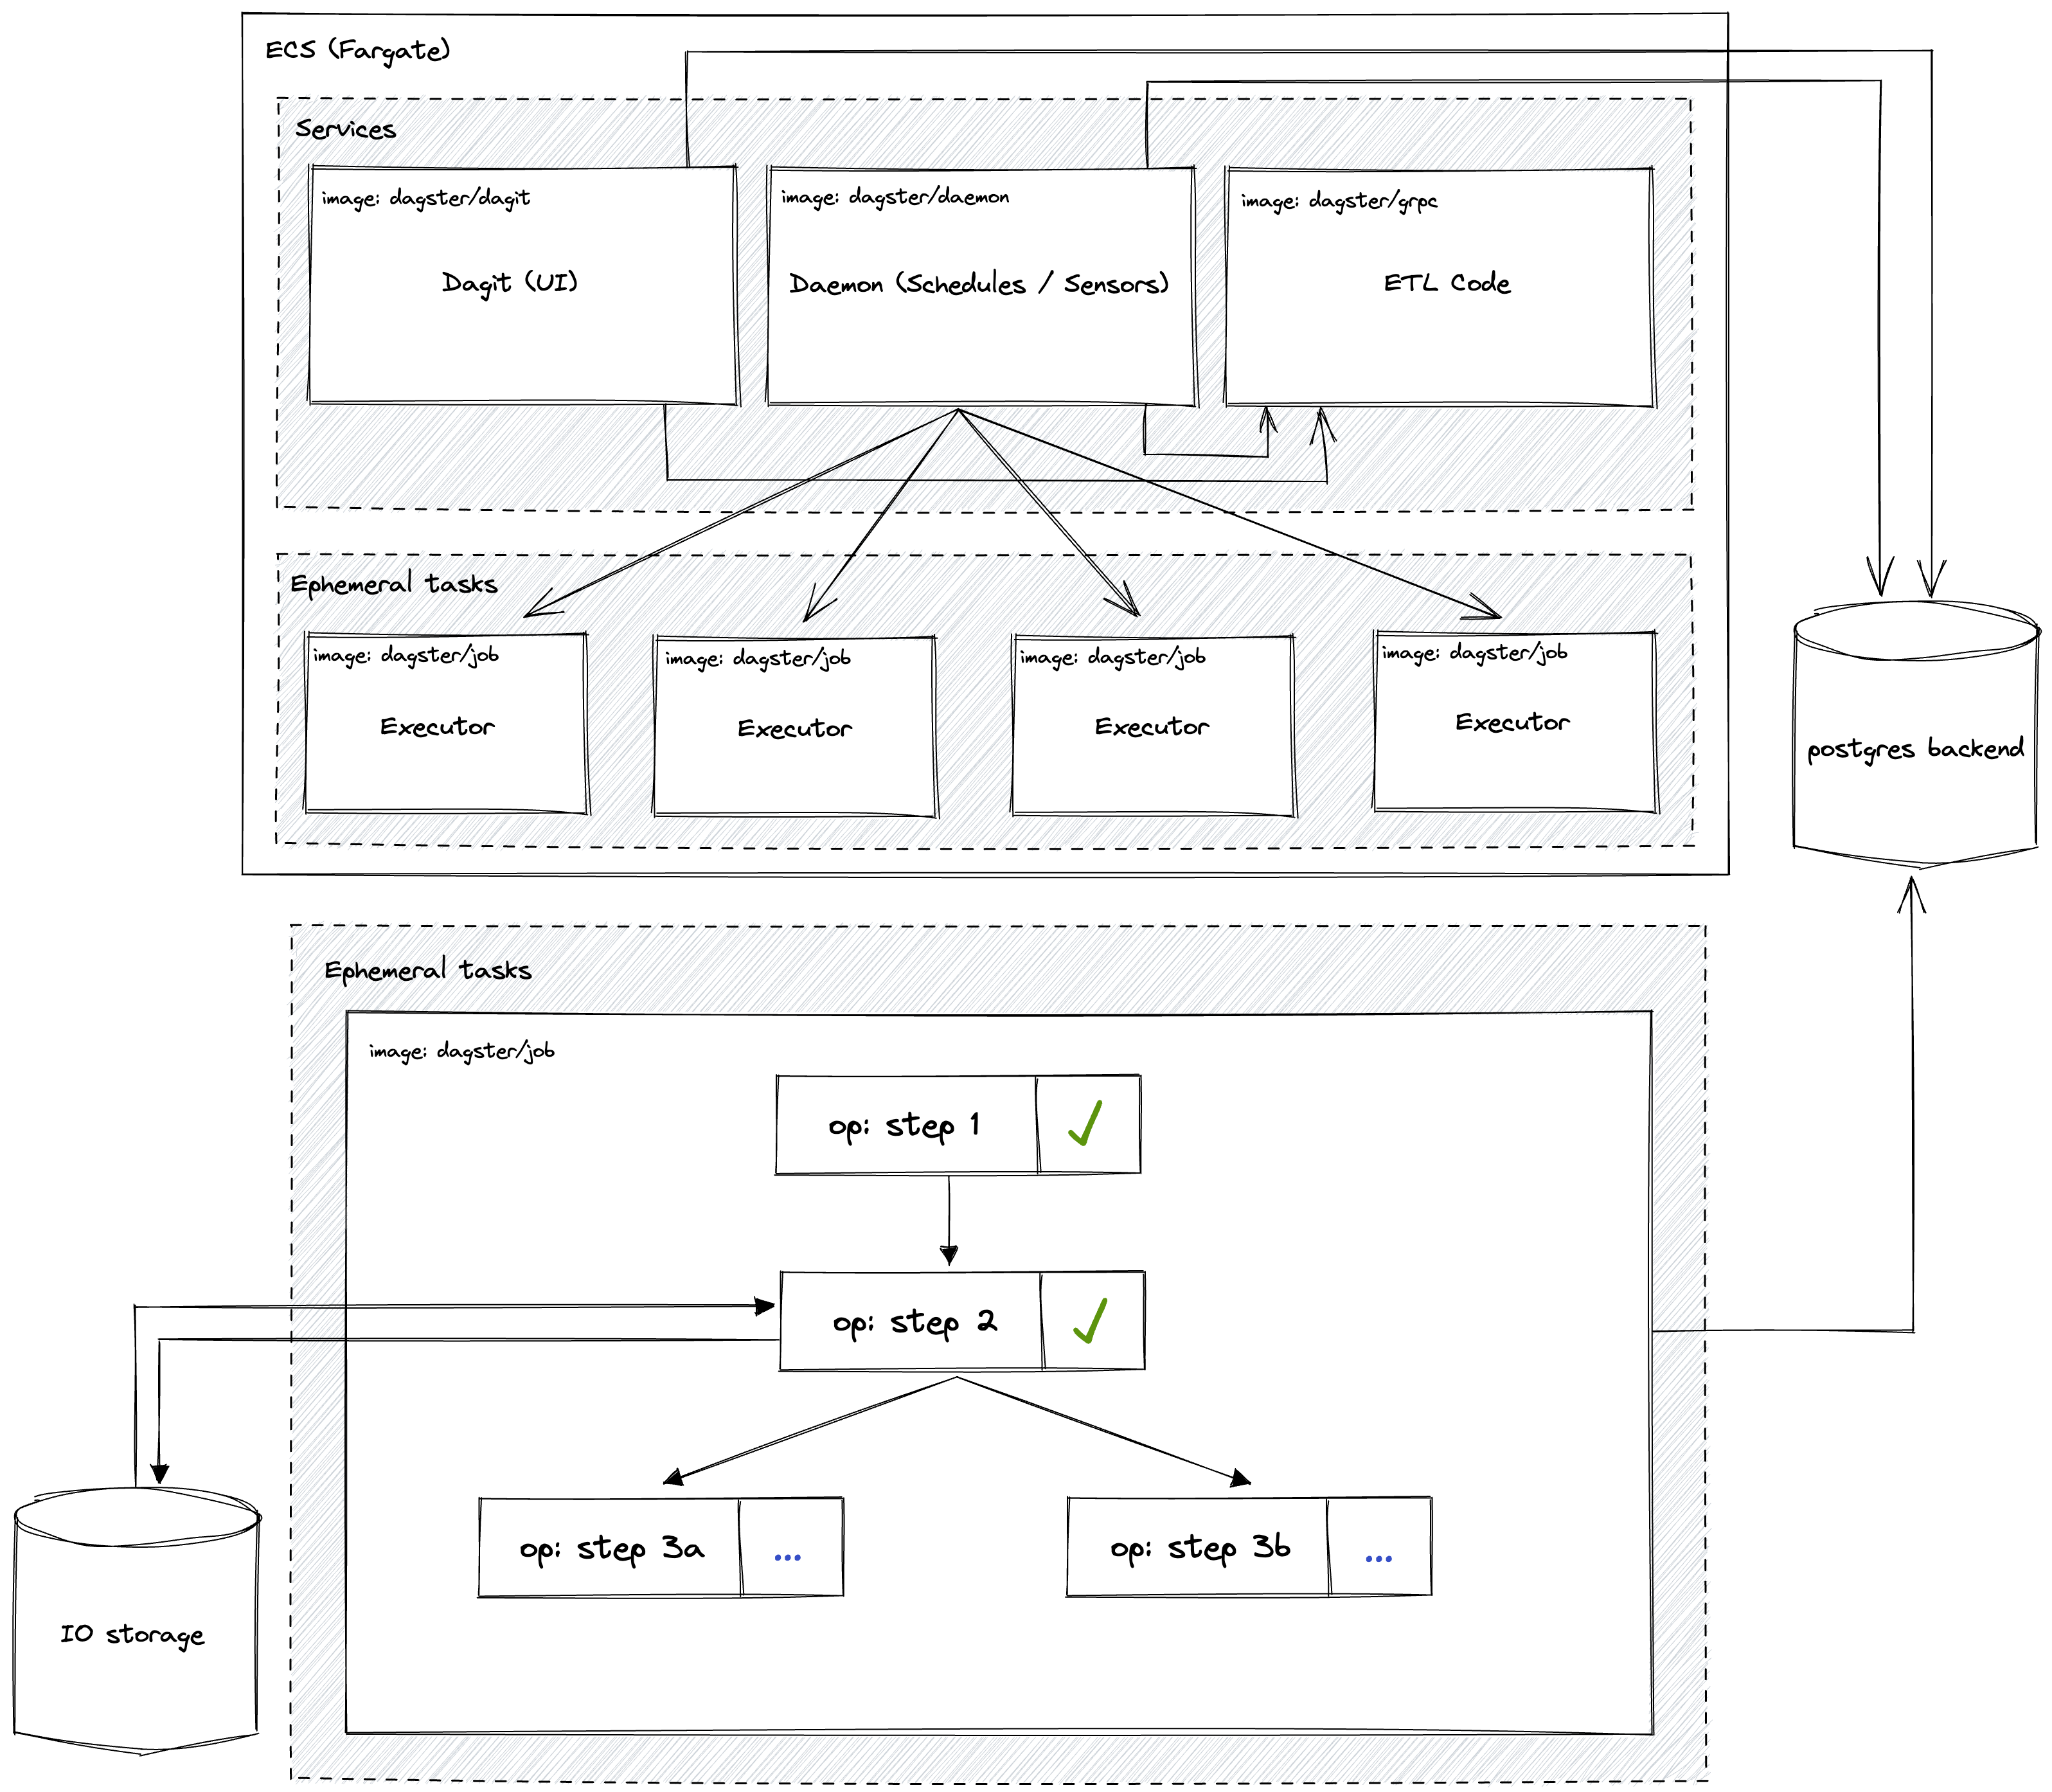
Established orchestration platform (Dagster) for multitenant data pipelines at both early and late-stage, SaaS startups. Managed infrastructure and CI / CD via Terraform and Github Actions.

I am Bethany Yollin from Seattle, Washington. I am a data platform engineer with experience delivering scalable and secure, foundational data platforms and self-service data products in fast-paced, start-up enviornments. Before pivoting to data engineering in 2020, I focused on building data products with rich, informative data visualizations.
Established orchestration platform (Dagster) for multitenant data pipelines at both early and late-stage, SaaS startups. Managed infrastructure and CI / CD via Terraform and Github Actions.
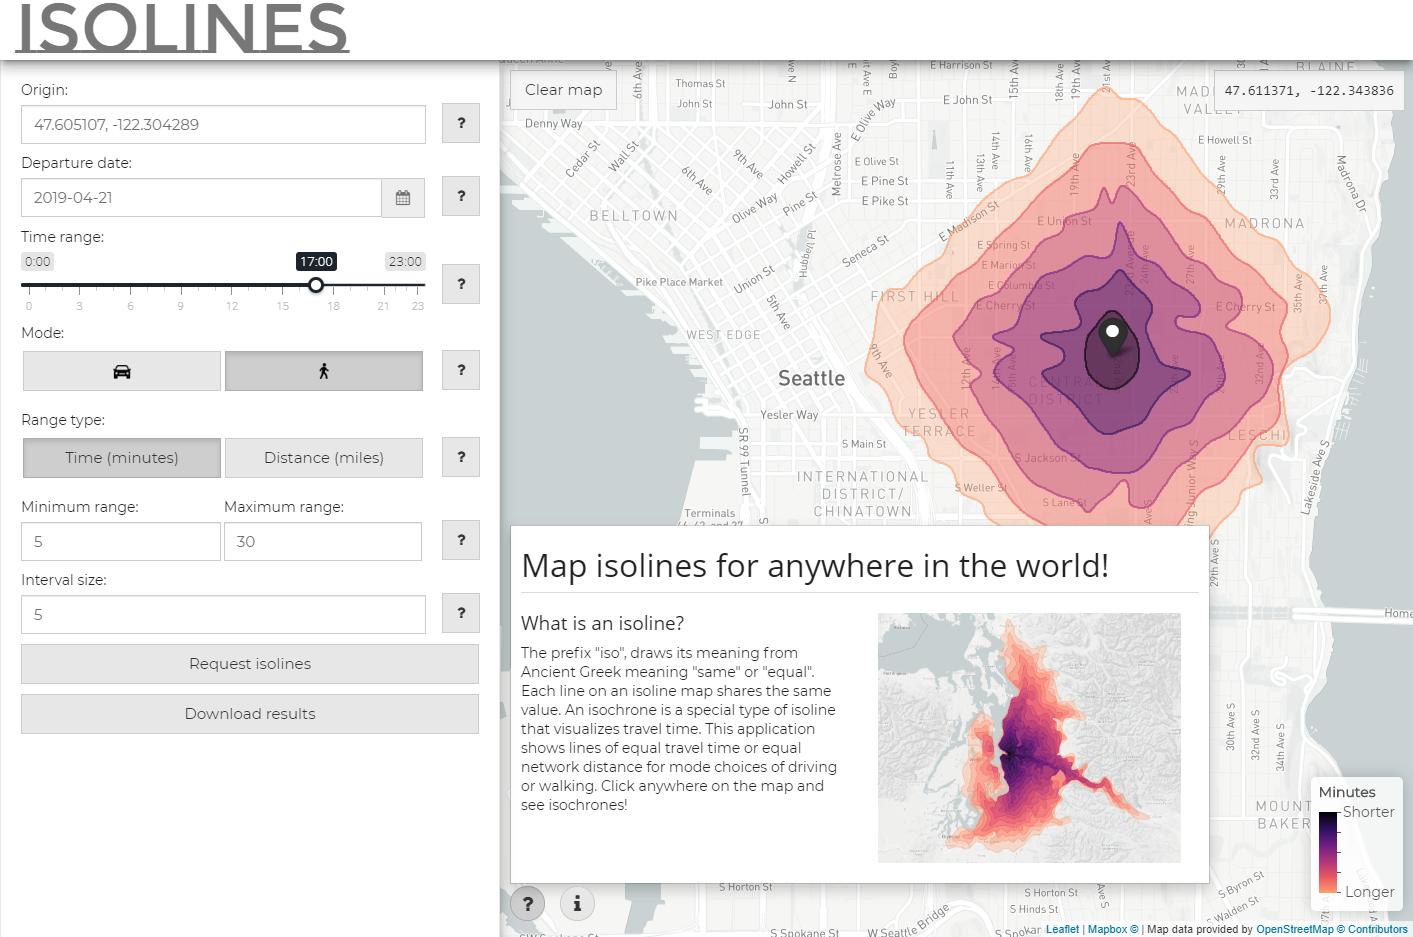
The isolines application displays lines of equal travel time (isochrones) from anywhere in the world. This application was built in R/Shiny and was an honorable mention in Posit's 2019 Shiny Application Contest. The underlying data was fetched from the HERE Isoline Routing API.
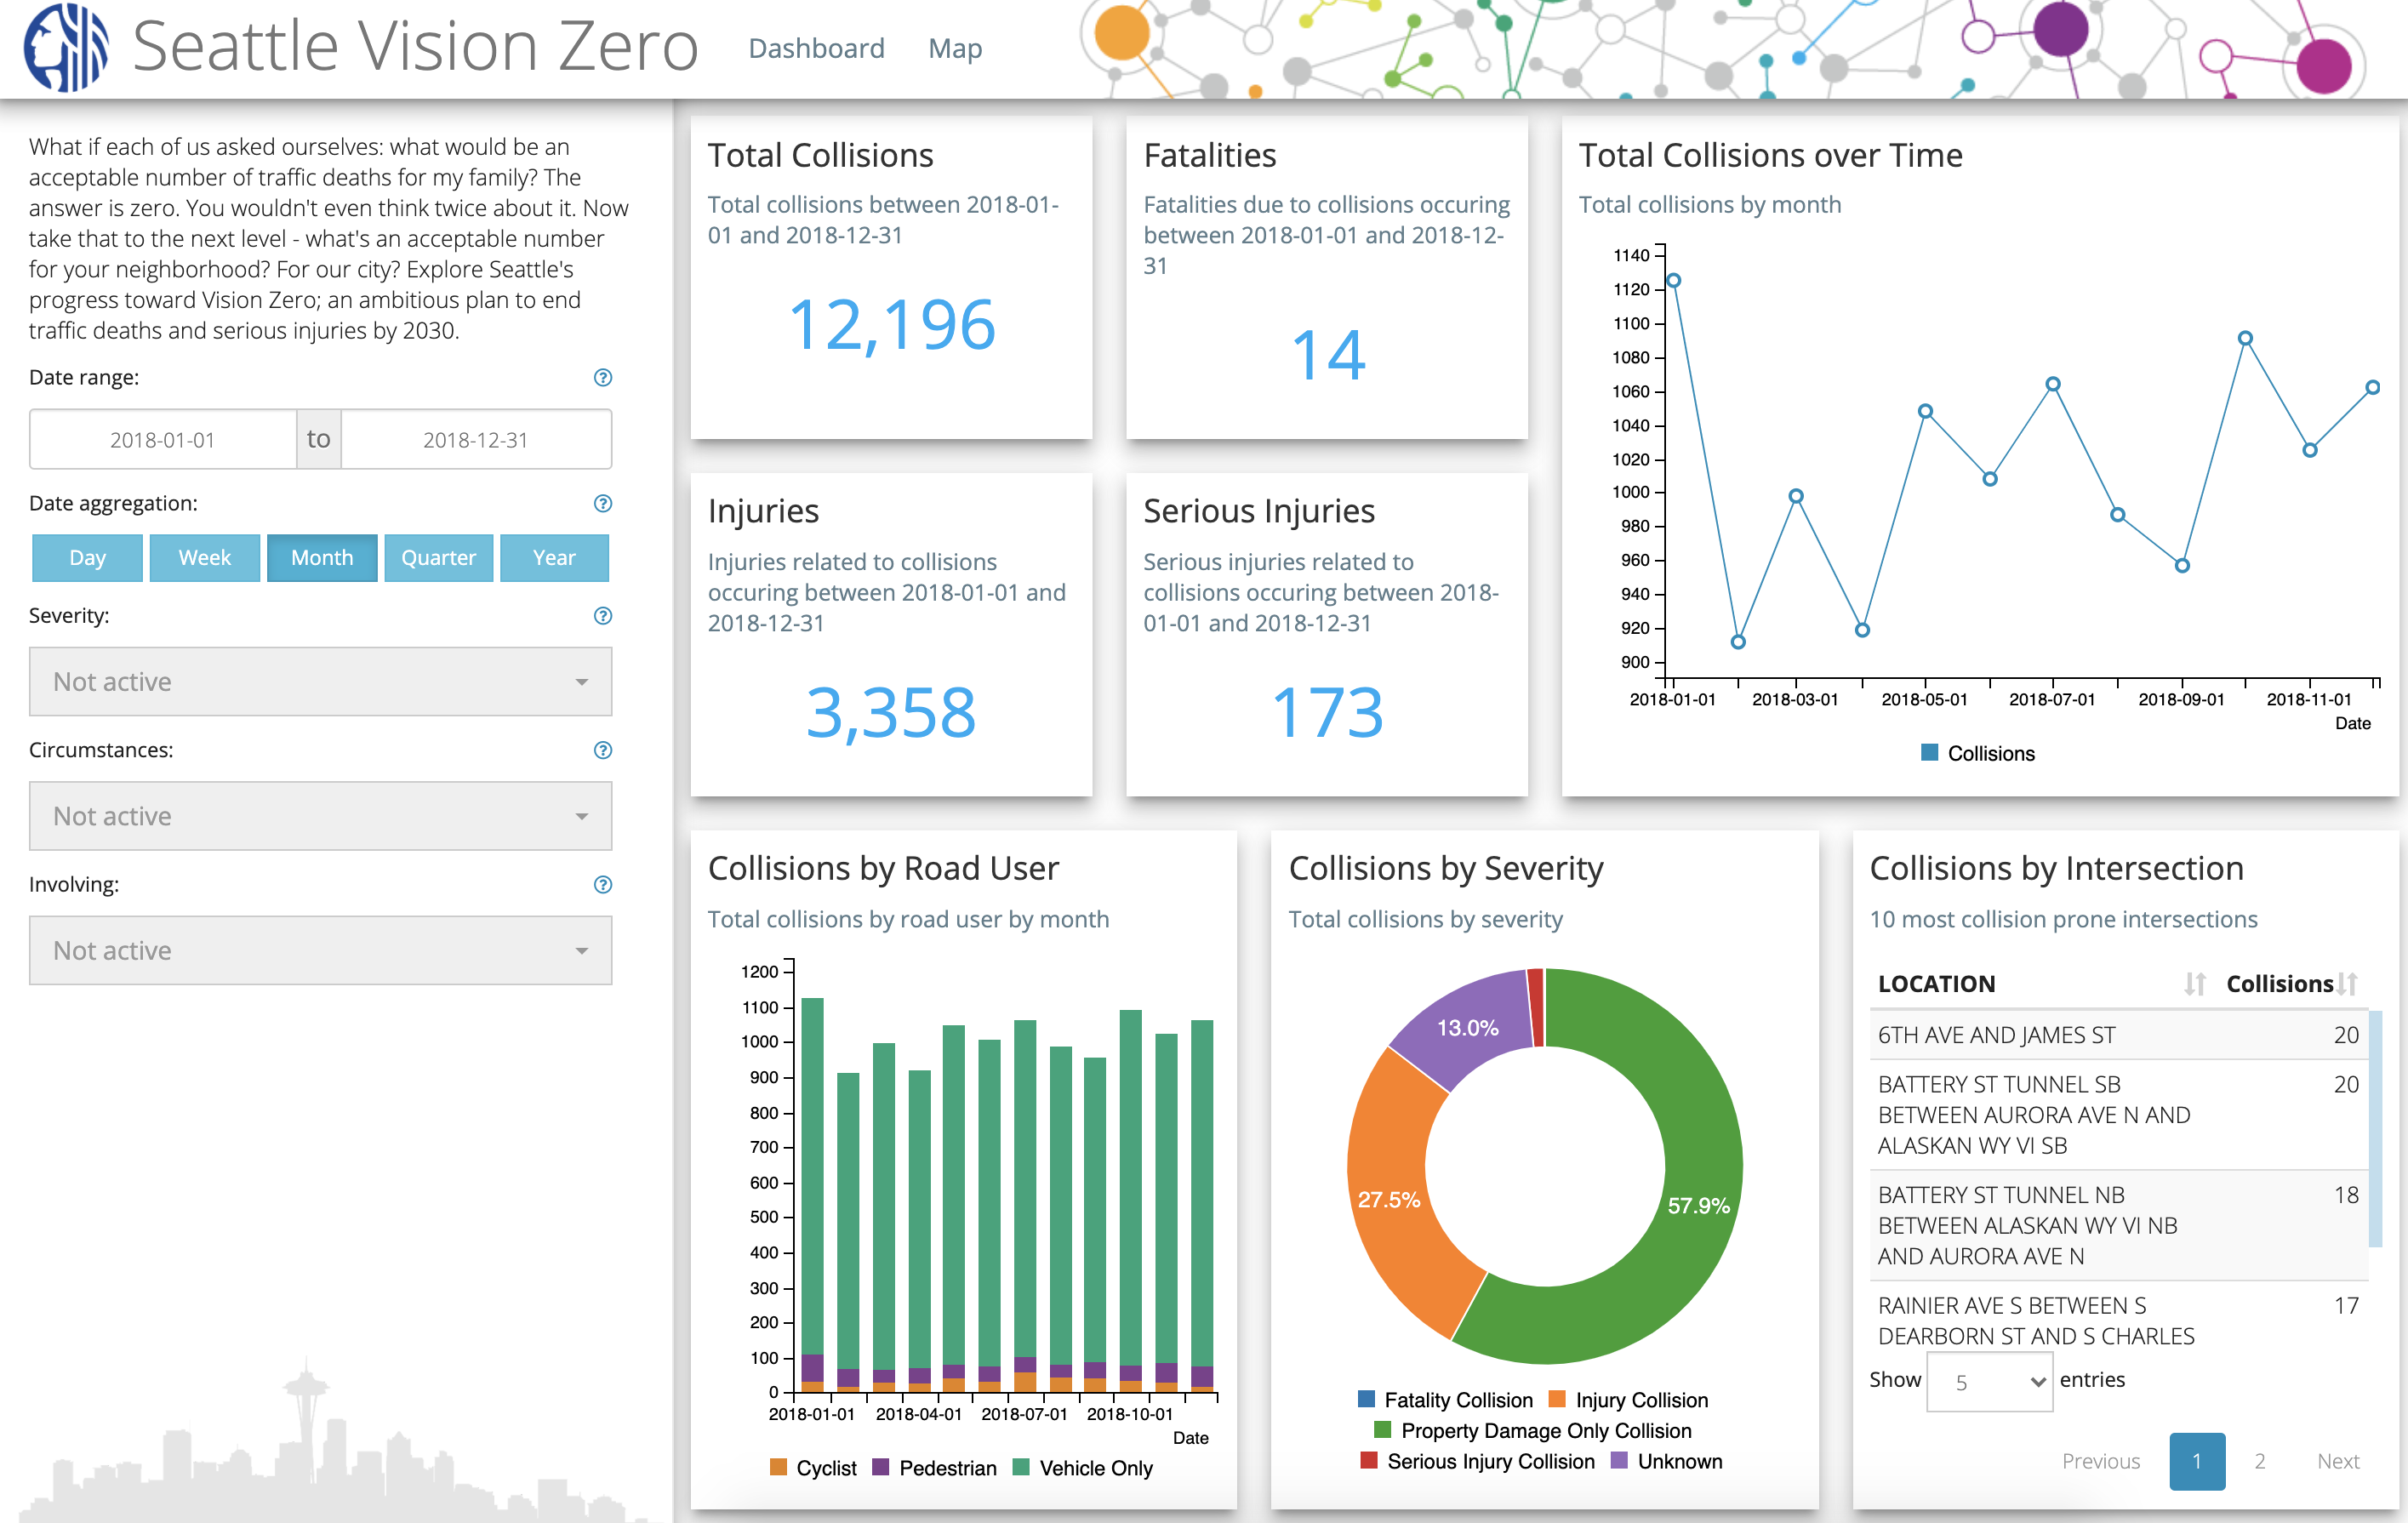
The Vision Zero dashboard tracks how Seattle is progressing towards elimating traffic-related deaths and serious injuries by 2030. This application was built in R/Shiny and highlights several Javascript libraries for interactive data visualizations including: highcharts, leaflet, datatable and more!
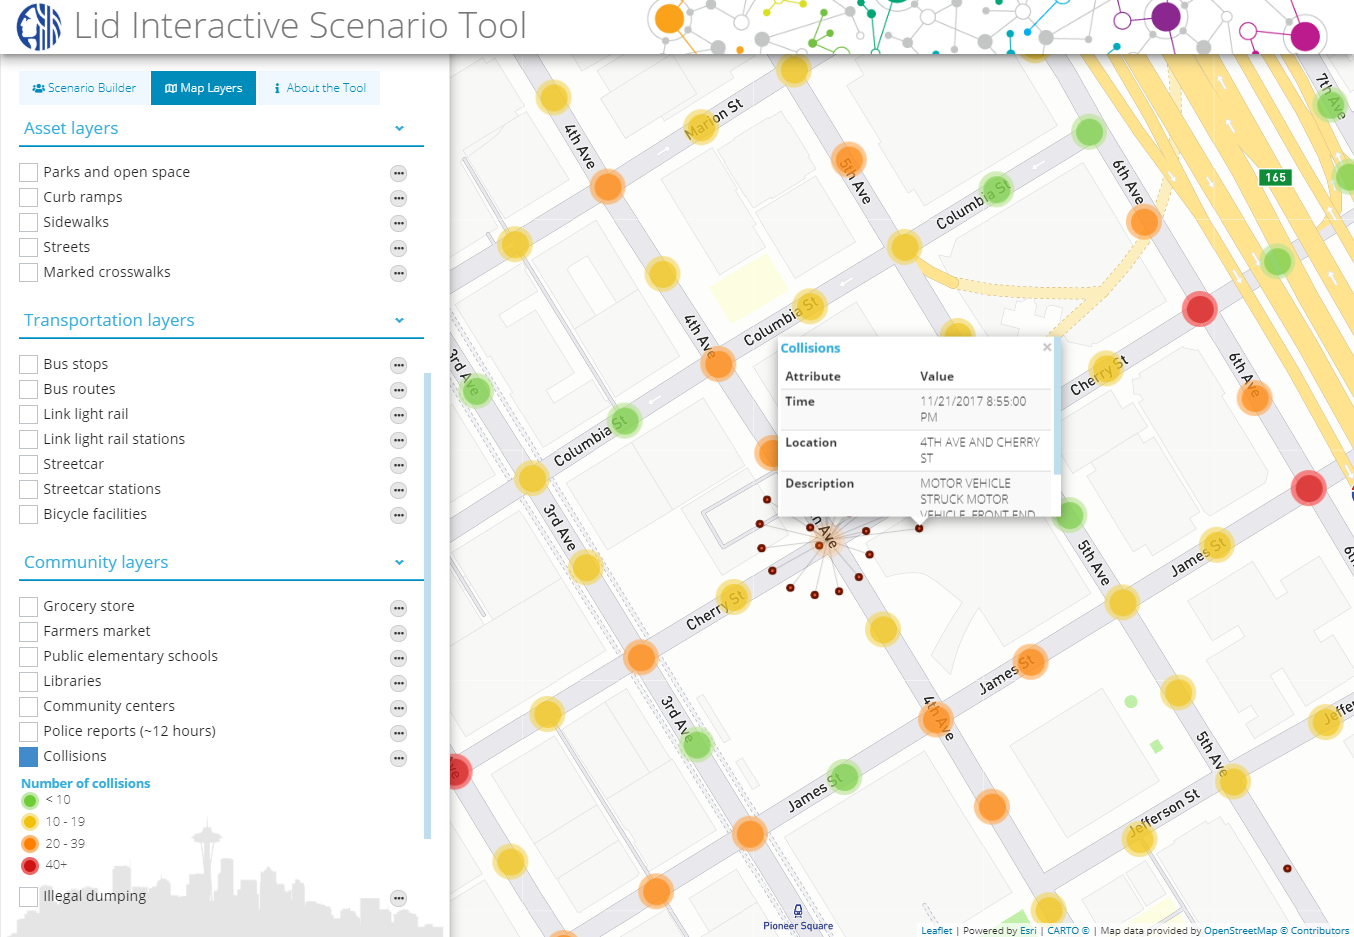
The Scenario Viewer was an interactive web map developed during my time working in a Seattle-based, transportation planning team. This tool helped our consulting firm win a landmark bid to help explore the feasibility of the proposed I-5 Lid; an ambitious proposal to reconnect neighborhoods that have been physically divided for over 50 years.
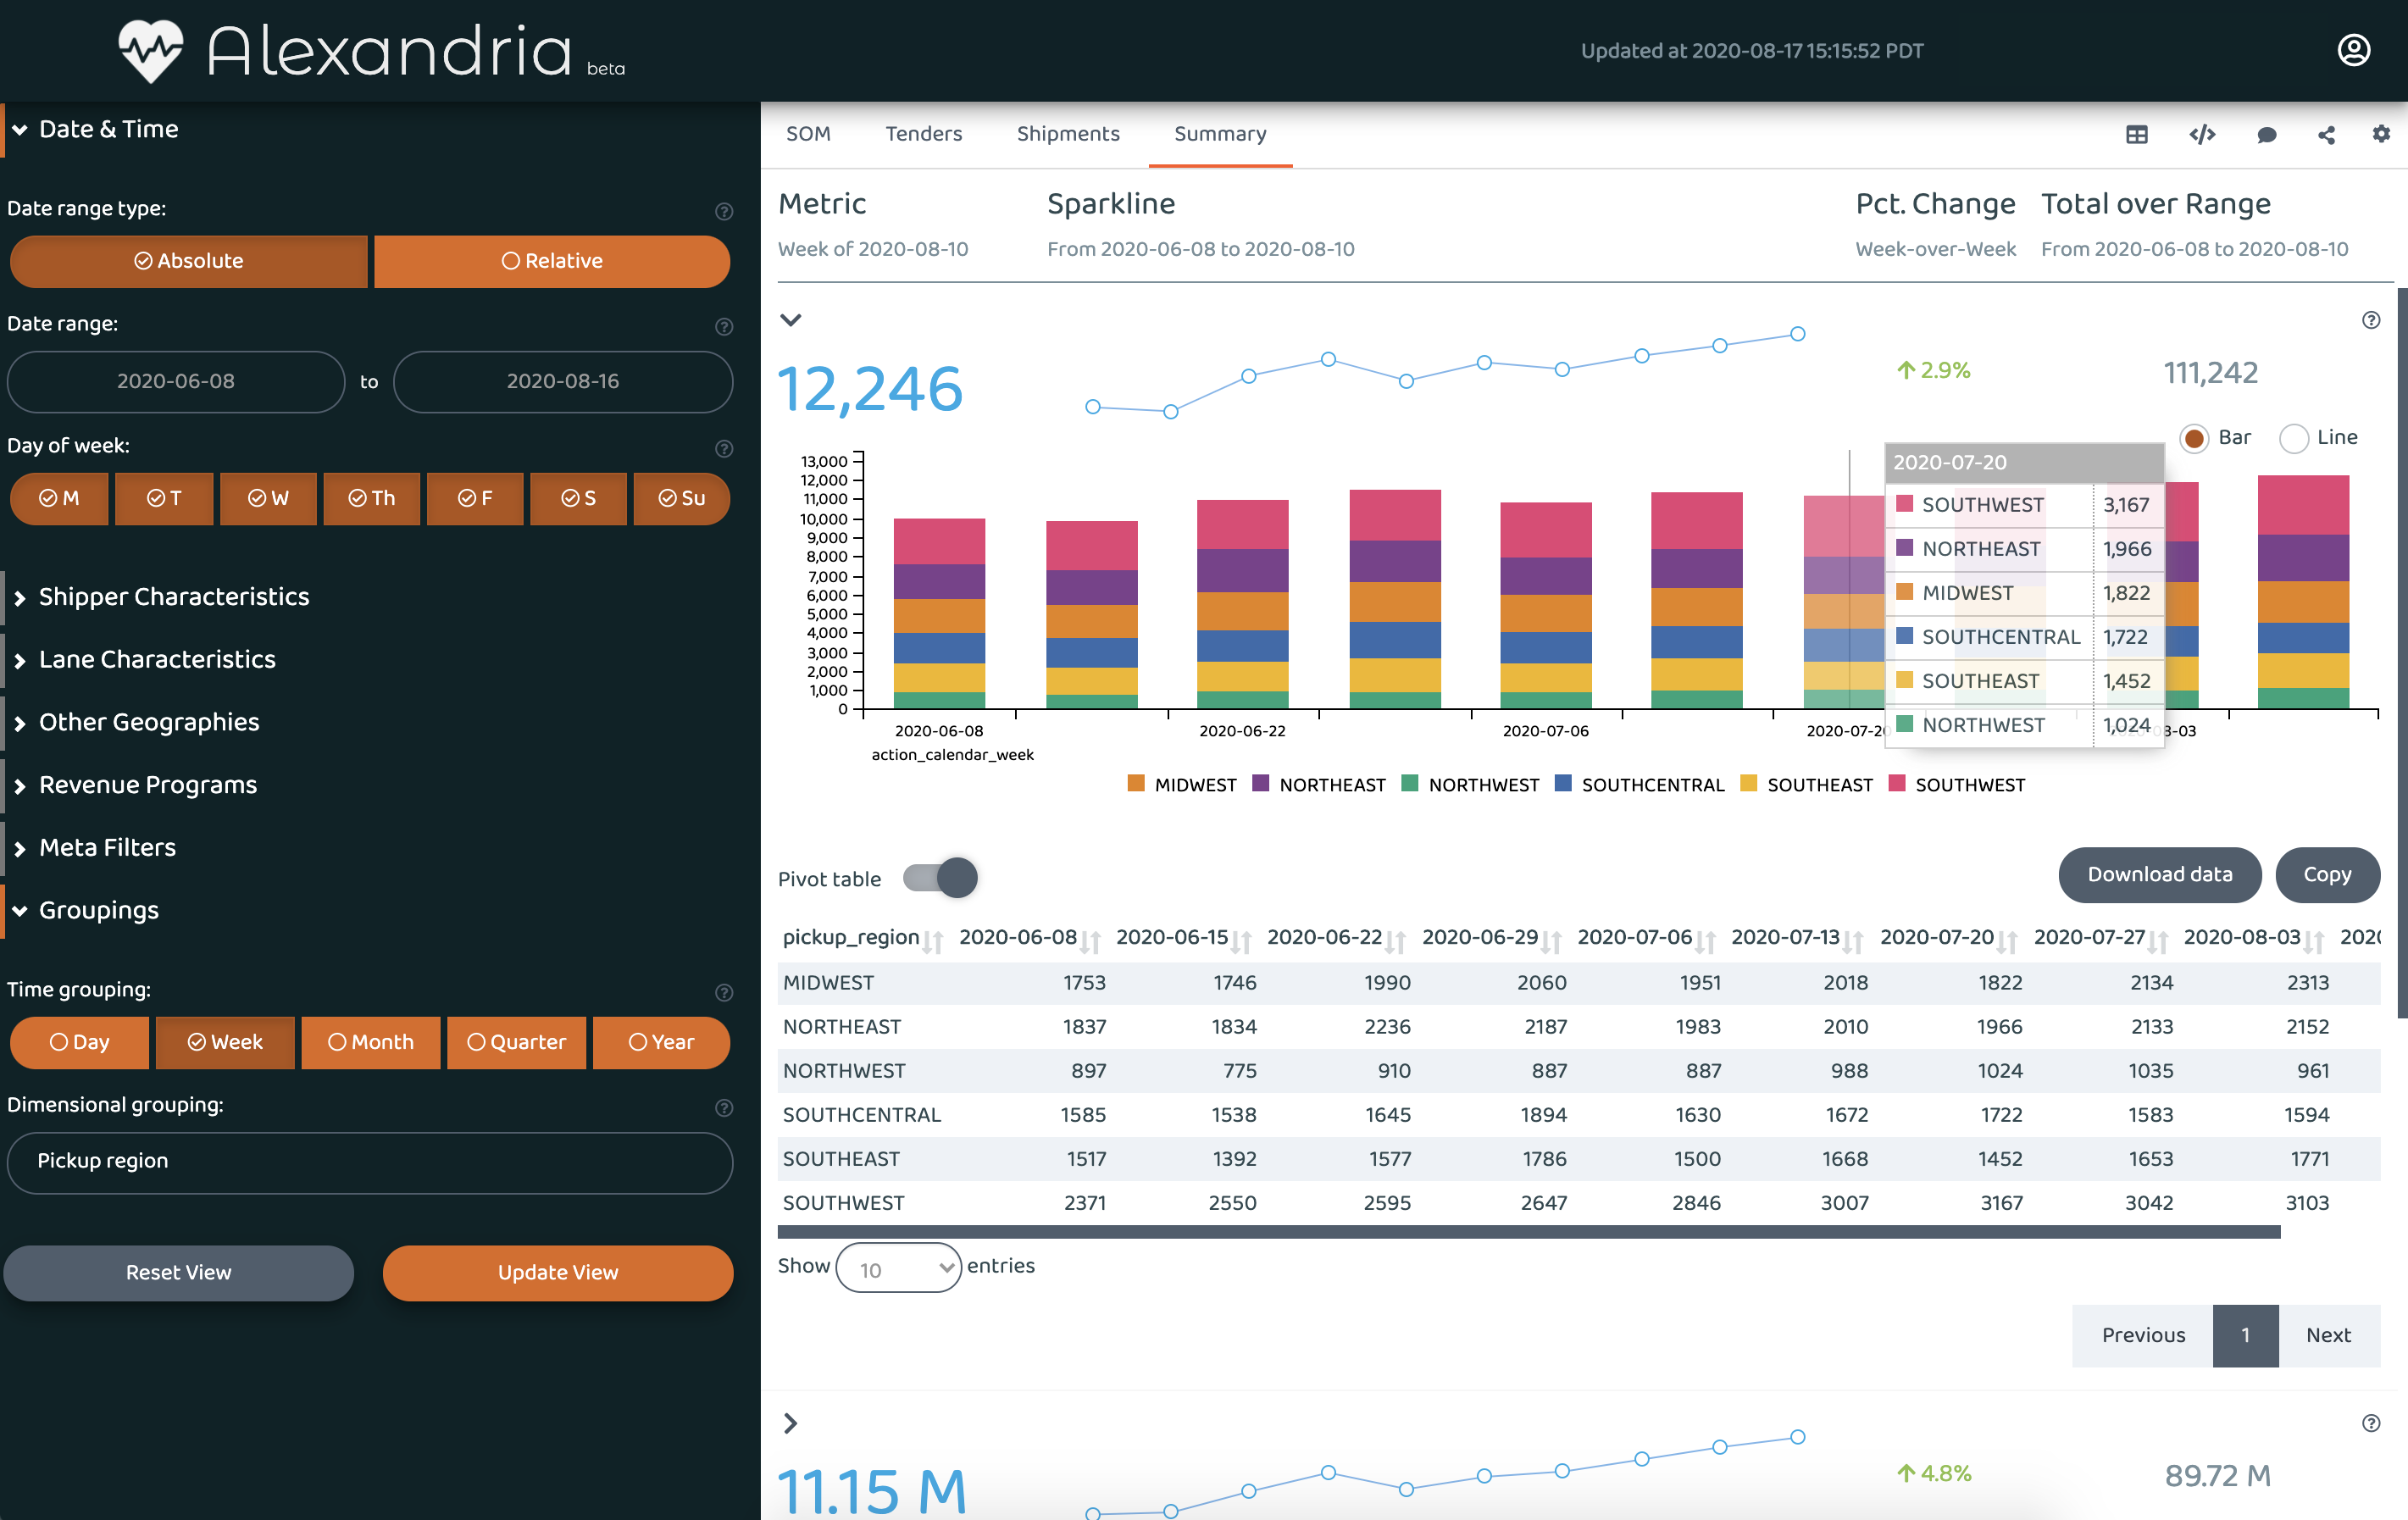
Alexandria was a realtime reporting dashboard with dozens of business monitoring metrics enabling staff to make quick, data-informed decisions. The application queried a Snowflake backend with models produced by Airflow <> dbt. The application was deployed on AWS ECS and later migrated to EKS. Managed infrastructure and CI / CD via Terraform and CircleCI.
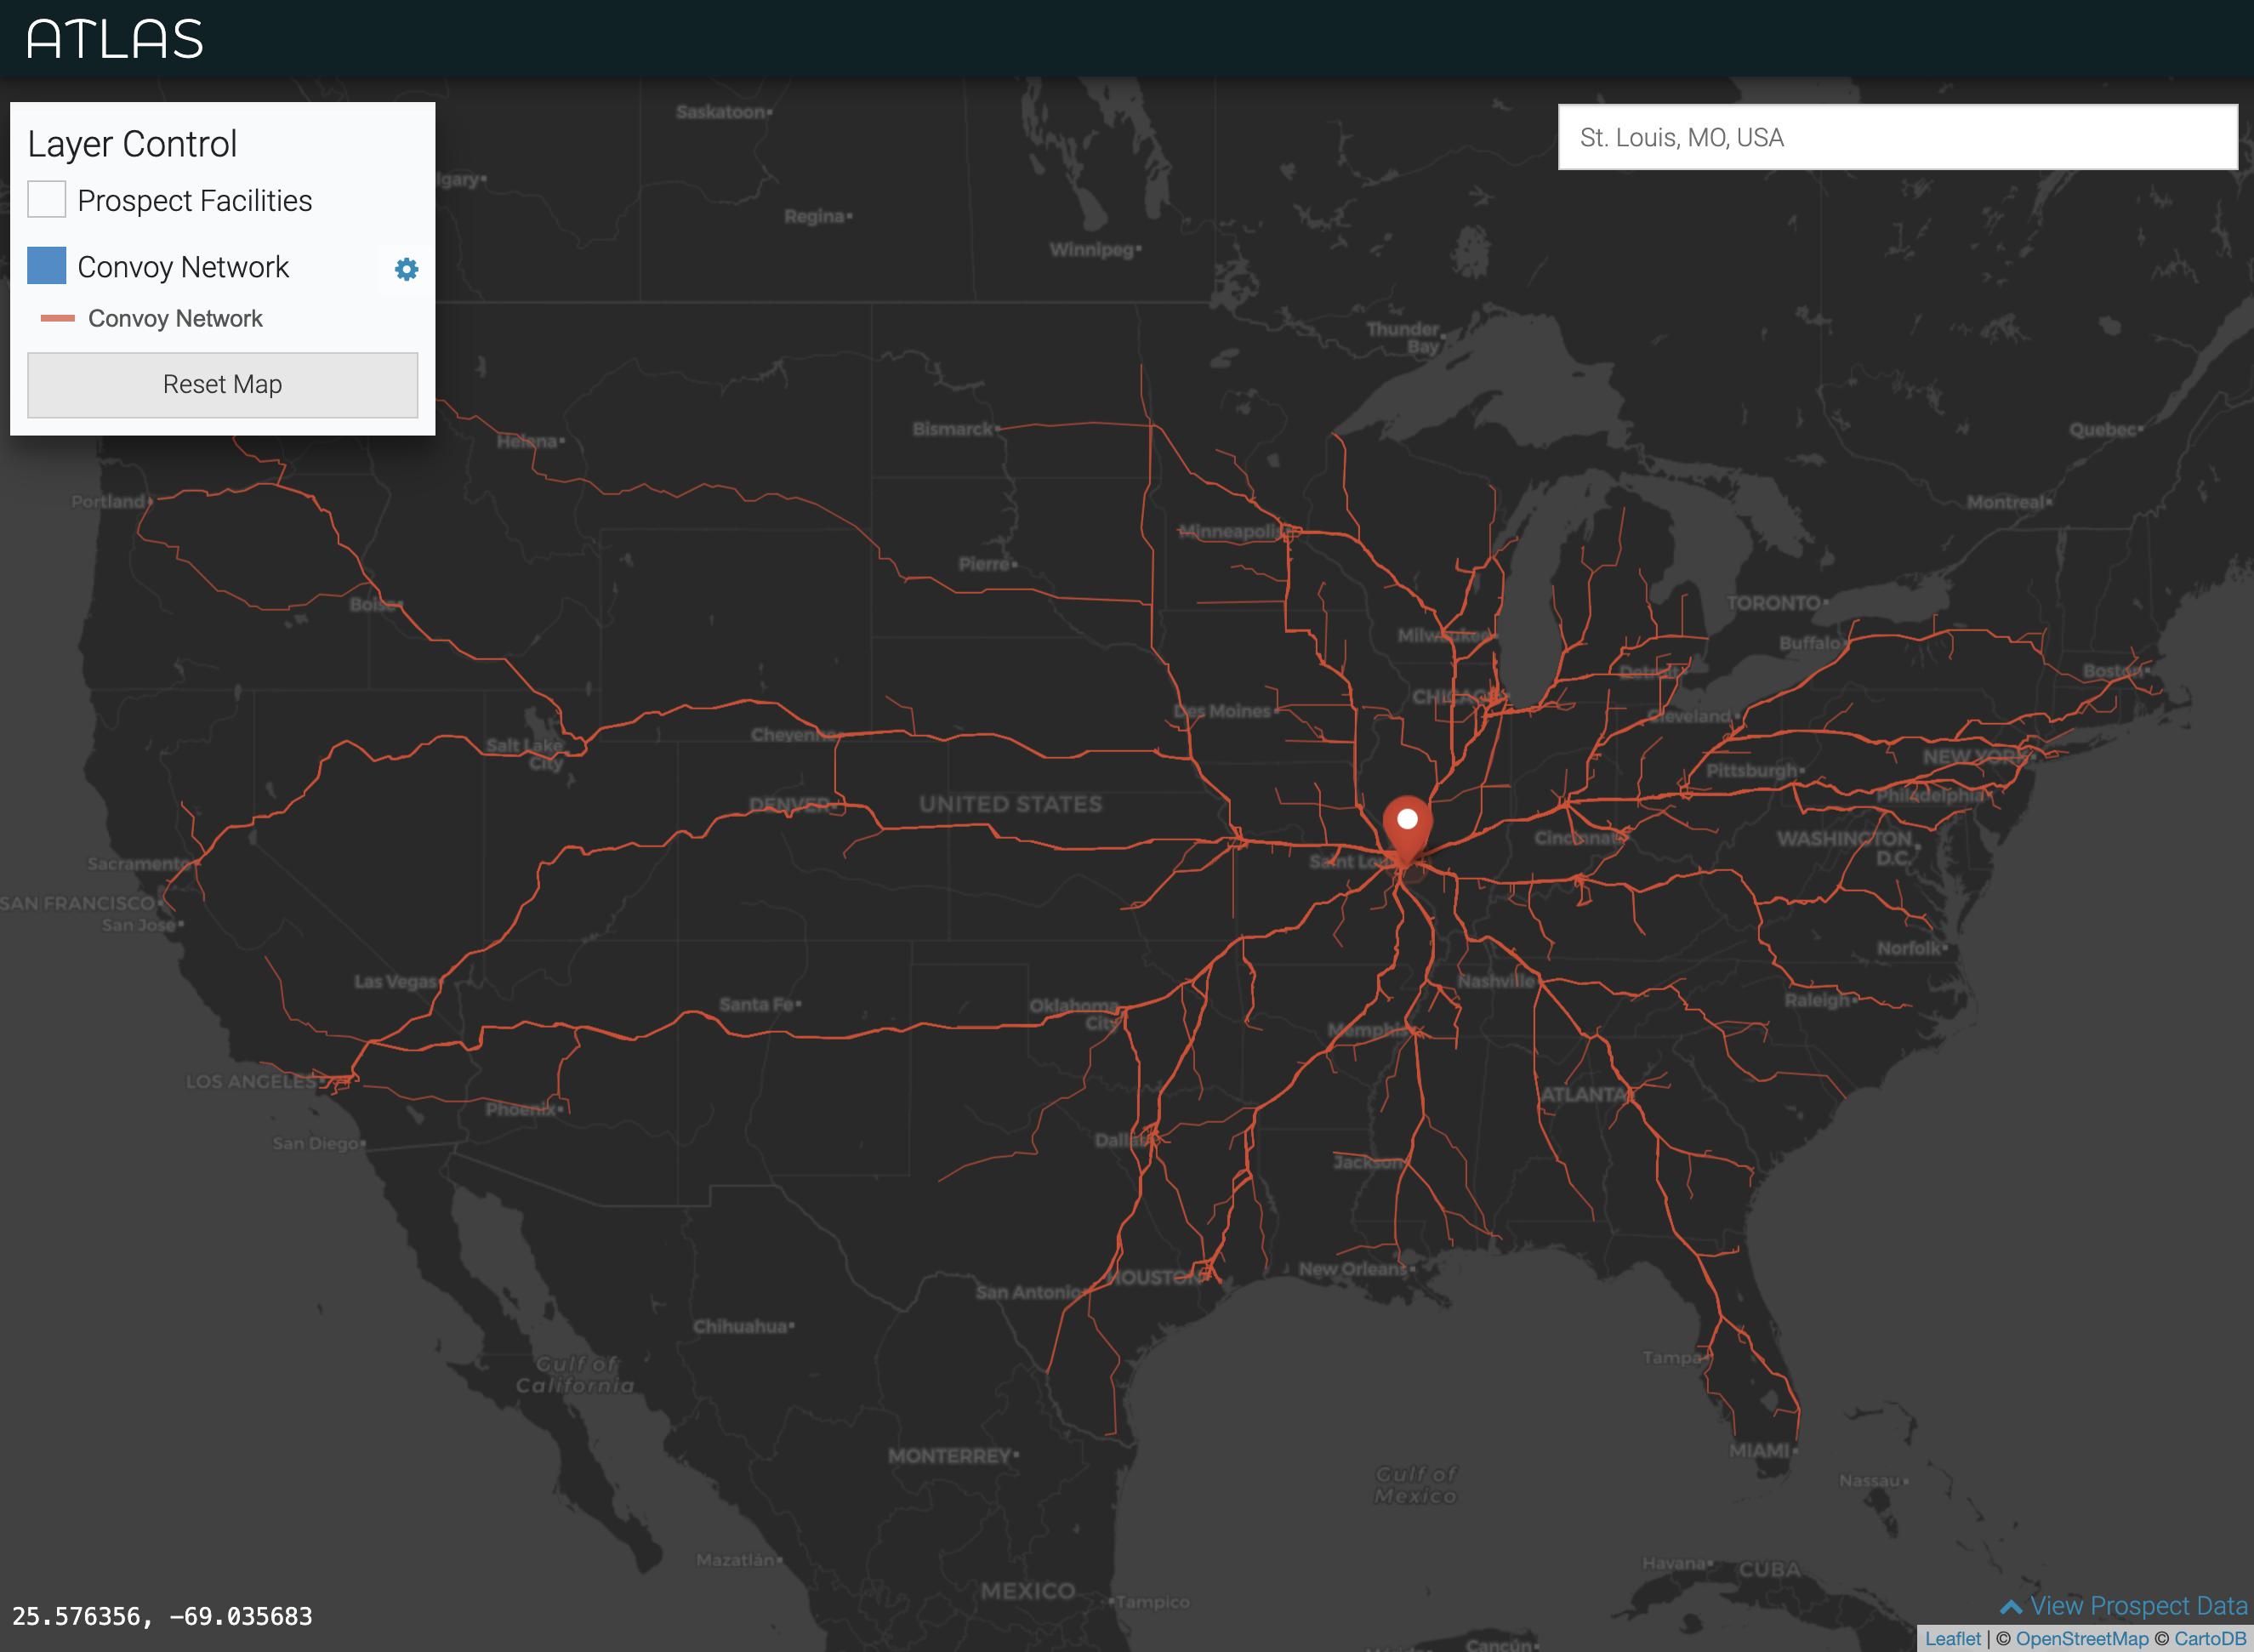
Origin / destination matrices are used to understand travel across nodes in graph. With my background in geography, I've created unique data visualizaiton tools to explore and make sense of this kind of data.